
Sponsored by:

Specialising in Action, Team and Portrait Photography.
---
Advertising opportunities available.
Please contact me.
---
Games Behind - How tables really look
TweetIT'S the most even season in not only the NBL's history but, arguably, in the history of elite team sports in Australia.
There have been tight seasons before in both the NBL and WNBL, where playoff teams were decided on season-series results.
But 2016-17? It's unprecedented.
Using (again) the US sports model which provides a clearer indication of how teams are faring than their win-loss ratio and points percentage - the latter factor irrelevant once the regular season ends and ties become ladder position determinants - the "games behind" column shows a truer picture.
Remember, all positions are judged against the team with the best record, with every win a team trails it by worth half a game and every loss more also worth half a game.
In that scenario, this is how the NBL table looks right now:
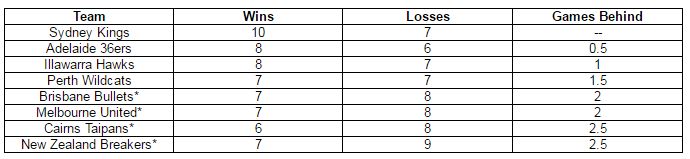
*Indicates teams are level and just separated alphabetically.
To know Cairns and New Zealand are two-and-a-half games out of first should make a lot more sense to fans of the Taipans and Breakers than the current ladder style.
Similarly, here is the WNBL table at the end of Round 10, Games Behind style:
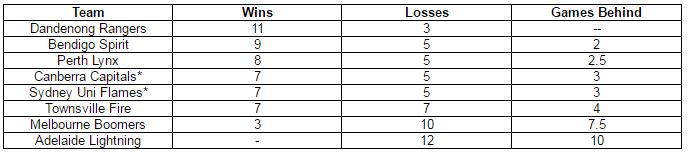
Just makes more sense, once you get the hang of it.
